
The headline number looks damning. U.S. electric vehicle sales totaled about 247,000 units in Q2 2026, up roughly 15% from Q1, yet still well below Q2 2025. That year-over-year gap is what the bears are citing. But gap analysis requires understanding what caused it, and the cause here is specific, datable, and already priced by the buyers themselves.
The dip followed the termination of the federal clean-vehicle tax credits after September 30, 2025. That credit was worth up to $7,500 on a new vehicle. When it disappeared, rational buyers either rushed the door before the deadline or stepped back entirely. Both responses are textbook consumer behavior, not structural rejection of the product.
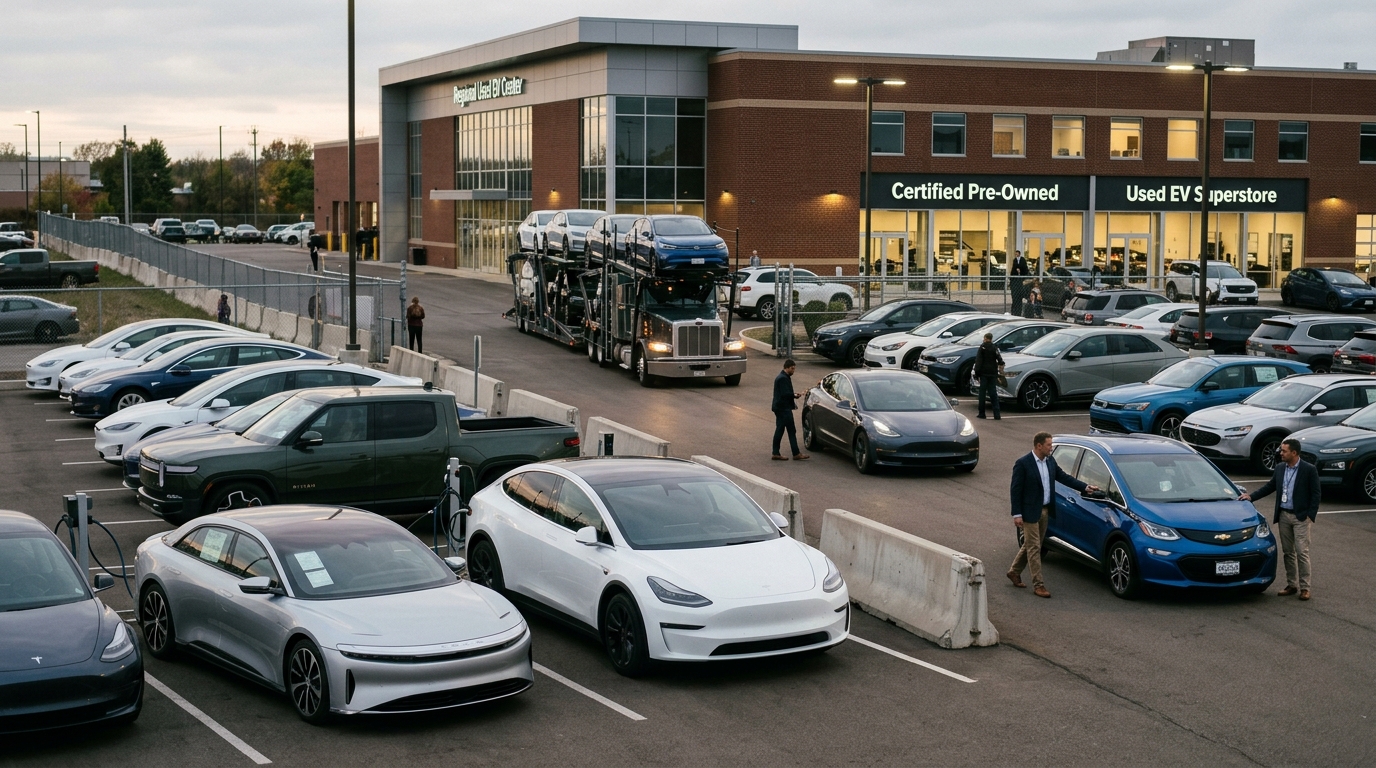
What happened next is the part the sales charts miss. While new EV sales slowed, the used EV market surged, with consumers increasingly turning to second-hand electric vehicles as a more affordable alternative. In August, EVs made up 7.9% of dealer used-car stock versus 5.2% in 2024, while their share of used sales rose from 5.1% to 8.6%. Supply is up, but demand is outrunning it.
This bifurcation is the story active traders need to read carefully. The new-vehicle market is contracting under policy pressure. The used market is filling the void. The used EV boom may actually accelerate mainstream electrification by making ownership accessible to millions of additional consumers. That is not a consolation prize for automakers, it is a demand base forming below the price point that OEM financial models were built around.
Europe adds another data point worth tracking. Multiple industry trackers now describe Europe as the main engine of growth in 2026, with roughly 10 million battery-electric and plug-in hybrid vehicles sold globally in the first half of the year and Europe posting the strongest growth rates among major regions. Meanwhile, passenger EV sales globally are on pace to reach 23.3 million in 2026, an 11% rise from 2025, driven by China and rising momentum across Southeast Asia, India, and Brazil. The U.S. contraction is real. It is also local.
Rivian’s Q2 results offer a cleaner read on what demand actually looks like when the product is priced appropriately. The company produced 12,613 vehicles and delivered 12,194 units, topping its own guidance range for the quarter, helped by commercial van growth, steady R1 demand, and the start of R2 customer deliveries. Rivian raised its full-year 2026 delivery guidance to 65,000-70,000 units, and has said the R2 lineup is expected to broaden beyond the initial higher-priced Launch Edition, with the long-discussed $45,000 variant arriving later.
The trader’s lesson here is about separating policy-induced volatility from underlying demand. When an incentive expires, volume drops. That drop is not evidence the market is broken, it is evidence the market was partly subsidy-dependent. The relevant question is what demand looks like once the pull-forward hangover clears. Used EV share rising faster than used EV inventory suggests the answer is: healthier than the new-car numbers imply.
Watch where the price compression in used EVs bottoms. When affordability and supply intersect at the right level, the next cohort of buyers steps in. That inflection is likely closer than the quarterly sales charts suggest.