
September 24, 2026
Today’s 7-year auction shows whether the selling is done.
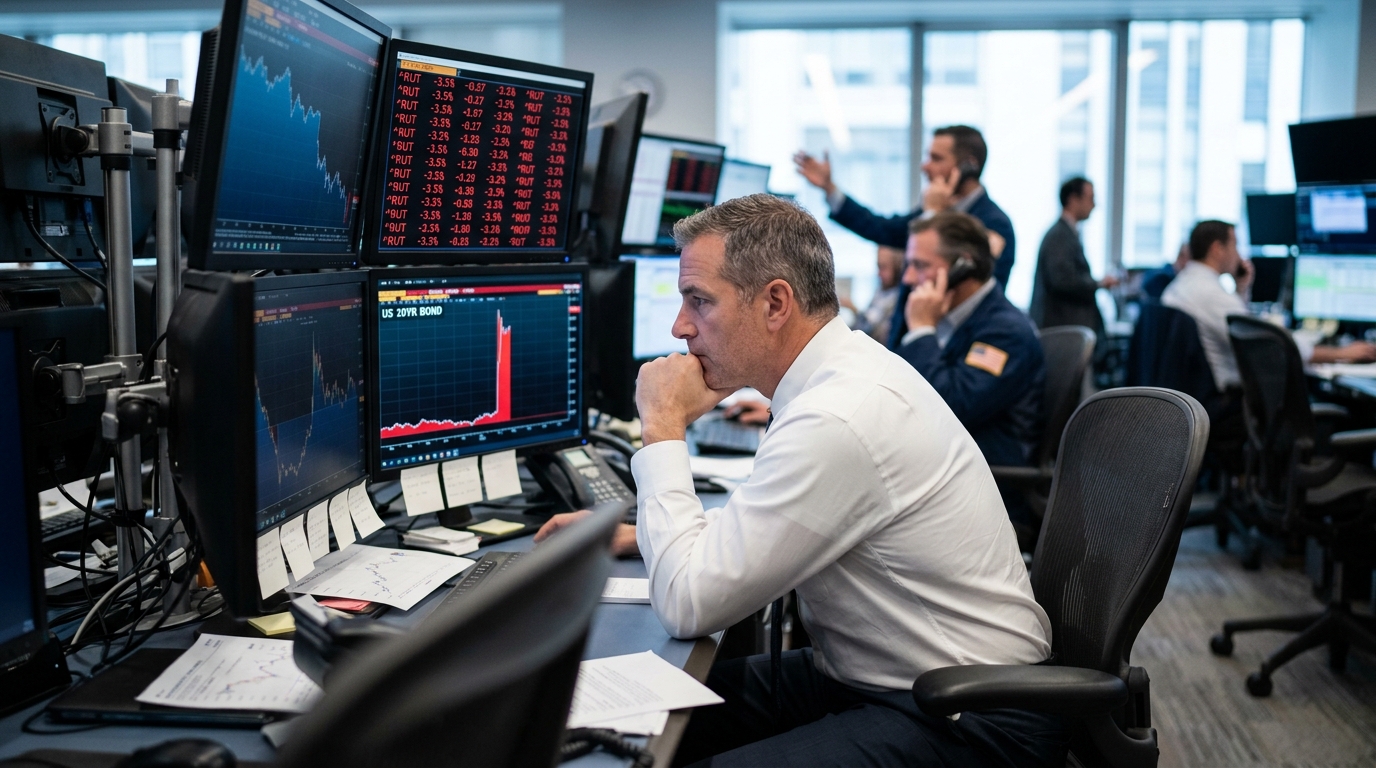
Wednesday was a masterclass in what happens when the bond market gets caught completely off-side. A single data release reshuffled the entire rate outlook in a matter of hours, and by the close, the Russell 2000 had absorbed more damage than any other major index. The lesson wasn’t just about PMIs or yields. It was about how fast a market reset can travel through the system when positioning and data collide.
Louis Navellier: My #1 AI stock for 2026 (name & ticker inside)
“I want to give you a free stock pick today. This company’s sales are up 28% year over year. It holds over 30,000 patents in wireless and video technology. And it just earned an A-rating in my proprietary Stock Grader system. That’s the same system that helped me flag Nvidia back in 2005 – before its 82,000% run. In fact, this system has identified the top-performing S&P 500 stock for 12 years running. Over the years, it has cost me $9 million to build and maintain. And right now, it’s flashing its highest possible rating on this AI play.” – Louis Navellier
Click here to see which AI stock my $9 million system is flagging right now, free.
What Happened
S&P Global’s flash US composite PMI for September climbed to 58.4, a 62-month high. Services jumped from 56.5 to 58.7, while manufacturing surged from 53.9 to 57.0, its strongest reading in more than four years. The consensus expectation was 54.9. That gap, nearly 3.5 points, is the kind of surprise that forces institutional desks to tear up their models in real time.
The 10-year Treasury yield surged 17 basis points to 5.12%, a fresh high for the year and the highest level since 2007. S&P Global’s Chris Williamson also warned that input costs in September rose at the steepest pace in nearly four years, led by fuel and transportation as oil prices climbed. That inflation signal is precisely why what should have been a bullish growth reading turned into a bond-market rout.
Then the five-year auction landed. The $70 billion five-year note priced at 5.033%, producing the second-largest tail on record and the weakest bid-to-cover since December 2018. Indirect bidders plunged to 54.31% from 61.51%, and dealers were left holding 15.8% of the auction, the most since May 2024. The bond market didn’t just react to the PMI. It rejected the Treasury’s offer price outright.
Why the Russell 2000 Took the Worst of It
The S&P 500 fell 0.8%, the Nasdaq dropped 1.1%, and the Russell 2000 underperformed with a 1.8% decline. That gap isn’t random.
Forget AI… this is how to really outthink the smart money
Our “Super Intelligence Trading Machine” is online…
And I want you to lock in access to it now – before word gets out.
Because it will help you tap into the market’s most profitable under-the-radar opportunities before the “smart money” can even figure out their first move.
Unlock instant access to a FREE report detailing the exact 4-hurdle evaluation engine used to pinpoint these hidden high-probability trades.
Roughly 32% of Russell 2000 debt is tied to floating rates, compared with about 6% for the S&P 500, based on widely cited strategy work using FactSet debt data. Small-cap companies tend to fund themselves with shorter-dated debt and bank credit. When the front end of the Treasury curve jumps, that funding gets more expensive in a hurry. Wednesday’s move wasn’t just a long-duration story. The 2-year Treasury yield rose about 14 basis points to around 4.89%, reaching roughly 4.94% intraday. That’s a direct hit to every small-cap borrower rolling over short-term debt.
Homebuilders fell 2.46%, airlines dropped 2.99%, utilities lost 1.92%, and regional banks fell more than 1%. These are exactly the sectors that populate the Russell 2000’s weight. NYSE new lows jumped, a sign the damage wasn’t confined to a handful of giant names.
How Professionals View It
The odds of a rate hike at the October 27-28 FOMC meeting jumped to roughly 73%, based on CME futures as reflected in FedWatch-style probability tools. Fed Governor Michael Barr said policymakers likely still have more work to do after last week’s quarter-point increase. “In my base case, further policy adjustments are likely to be needed,” he said in prepared remarks for a Chicago Fed housing affordability conference.
Experienced traders read the auction internals as the more alarming signal. A 3.1-basis-point tail means buyers demanded meaningfully higher yields than where the market was trading. When foreign central banks step back and primary dealers absorb a disproportionate share, the question stops being about short-term volatility and starts being about structural demand. Two consecutive weak auctions would force a very different conversation about who exactly is left to buy Treasuries at these levels.
Trump Just Changed 401(k) Rules Forever
Your 401(k) may be about to change in a way most Americans haven’t heard about.
President Trump’s Executive Order #14330 is pushing a major shift in how retirement plans can invest – and it has now reached the Department of Labor for approval.
Get the full story and see how your retirement could be impacted.
What Comes Next
Today’s 7-year auction is the immediate read on whether Wednesday’s selling reflected a one-day dislocation or something more durable. The 7-year auction on September 24 is the immediate test. Watch the tail and the indirect allocation. Two consecutive weak auctions would make the structural demand destruction thesis considerably harder to dismiss.
Watch the indirect bidder percentage specifically. A recovery toward the recent average would suggest Wednesday’s weakness was positioning-driven and temporary. A second straight reading below 55% is a different kind of problem entirely, one that puts pressure on both TLT and IEF and gives traders reason to expect yields to stay elevated into the October 27-28 FOMC meeting.
The Trader’s Lesson
Wednesday proved that good economic data is not inherently good for equities. Context determines the reaction. In a market where the Fed has just raised rates and 70%-plus odds of another hike are already in the market, a PMI print showing accelerating growth alongside the steepest input-cost inflation in nearly four years is a rate threat first and a growth story second. Traders who positioned for a relief rally on strong activity data got the direction exactly backward. Before chasing a growth catalyst, the more useful question is always: what does this mean for the cost of money?