
September 26, 2026
Bonus Content: The 30-Year Treasury Hit 5.50%. Here Is What It Broke.
Dear Friend,
Elon Musk called Anthropic “evil.”
Then he leased them his entire flagship supercomputer – every GPU, every megawatt – for $1.25 billion a month.
$15 billion a year. $45 billion over three years.
It’s the largest AI compute contract ever signed.
But here’s what nobody’s asking: what keeps those machines running?
Not software. Not chips. A permanent power system that doesn’t exist yet.
The temporary turbines powering Colossus expire on January 2nd. Without a replacement, the $45 billion contract – and SPCX’s valuation – goes dark.
One small company builds permanent power systems faster than anyone in America.
Dylan Jovine has the full story.
See the stock behind the $45 billion contract >>
“The Buck Stops Here,”
Kelly Maguire
Behind the Markets
The 30-Year Treasury Hit 5.50%. Here Is What It Broke.
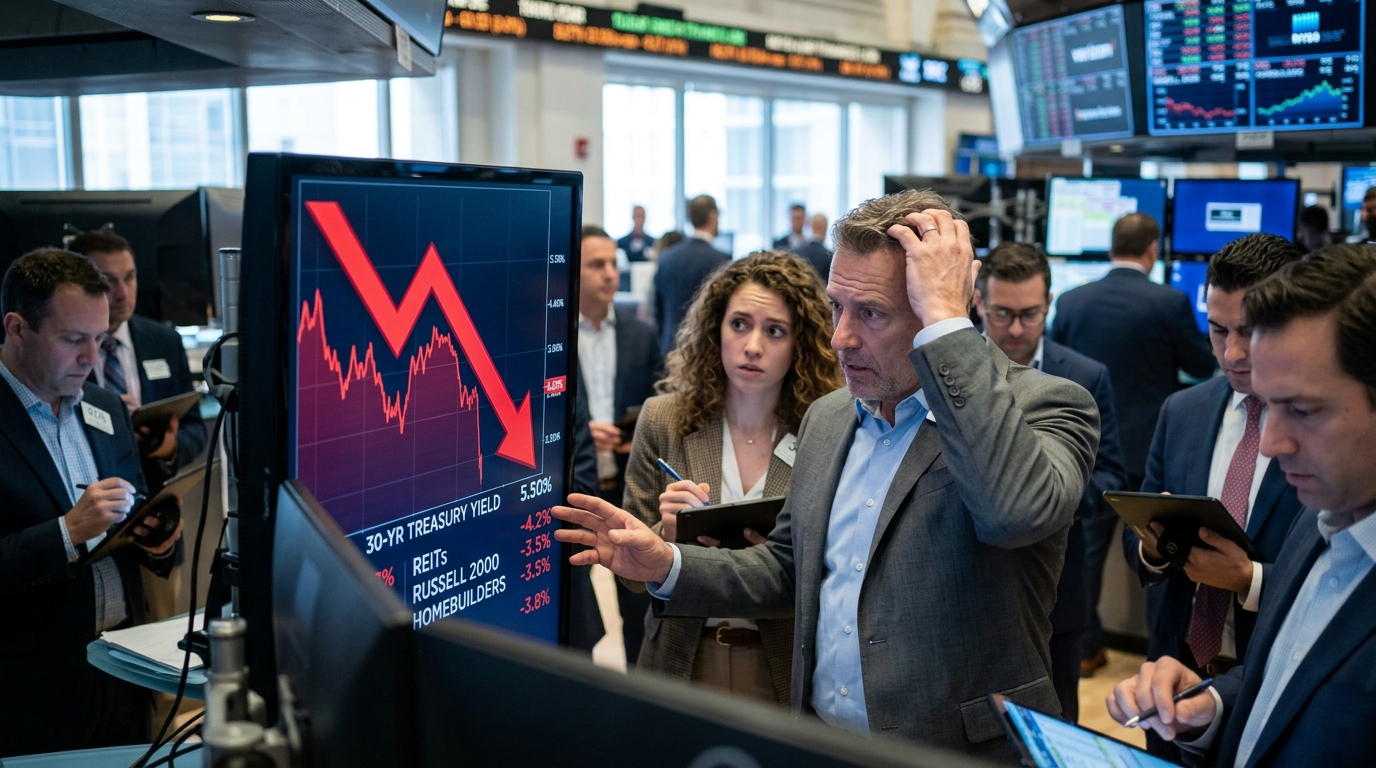
When the 30-year Treasury yield touches 5.50% and the 10-year crosses 5.22%, these are not just numbers on a screen. They are prices telling every portfolio manager in the world exactly how much the risk-free rate now demands. On Thursday, those prices arrived. And the stock market responded by breaking the sectors that can least afford to pay the new toll.
What Happened
The 30-year Treasury yield hit a high of 5.501%, a level not seen since June 2004, while the benchmark 10-year note climbed to 5.223%, reaching levels not seen since June 2007. That followed a bruising Wednesday session: the 10-year surged more than 15 basis points in a single day, one of its sharpest one-day jumps in more than a year. The move was global. Japan’s 10-year JGB yield rose to its highest in about 30 years, while UK Gilts and German Bunds also moved higher, with yields on various European bonds hitting fresh multi-year highs.
Behind the acceleration: the selloff deepened after a stronger-than-expected S&P Global US Flash PMI, with the manufacturing index jumping to 57.0 in September from 53.9 in August and price pressures intensifying across both goods and services. Good economic data read as bad news, because it handed the Fed more justification to keep tightening.
Which Sectors Broke, and Where Volume Showed Up
The damage was concentrated and logical. Utilities and real estate investment trusts, the dividend-heavy sectors most directly competing with Treasuries for income-seeking capital, each fell more than 1%.
Homebuilders slid, but not as dramatically as some headlines implied. The iShares U.S. Home Construction ETF fell about 0.5% on Thursday after dropping roughly 2.5% on Wednesday, as markets absorbed the message that higher long-term rates could further weigh on mortgage affordability and housing demand.
Small caps took the sharpest hit relative to scale. Rising 10-year yields punished TLT and kept pressure on small-cap IWM, as floating-rate debt makes smaller companies the fastest casualties of sustained high rates. The correlation between IWM and TLT currently sits around 0.51, compared to roughly 0.29 with SPY, which helps explain why IWM bleeds while large-cap indices hold up. Airlines fell nearly 3%, semiconductors dropped about 1%, and regional banks lost more than 1%, a broad indictment of anything with a financing cost that just reset higher.
One sector refused to cooperate with the selloff. Energy was the day’s clear outperformer as oil prices bounced amid shifting headlines around U.S.-Iran talks, though higher crude also added to the market’s inflation concerns. That last part matters. Energy rising on geopolitical supply risk is not the same as energy rising on growth demand. When oil pushes yields higher through the inflation channel, it is not a healthy rotation. It is fuel on the fire.
Why the Fed Is the Accelerant
New York Fed President John Williams said Thursday it would be reasonable to expect another rate hike from the Federal Reserve by year-end. At the September meeting, 16 of 18 policymakers projected at least one more hike before year-end, with four seeing two additional increases as possible.
Williams also said the time for explicit forward guidance was over, echoing Fed Chairman Kevin Warsh, who has emphasized the central bank will be less explicit about signaling future moves. That absence of guidance is its own market event. When the Fed refuses to anchor expectations, the bond market fills the vacuum, and right now it is filling it aggressively.
Three Things That Would Have to Happen for the Selling to Stop
First, CPI would have to surprise meaningfully to the downside. Recent data shows the U.S. economy remains strong while inflation stays above 3%, and Boston Fed President Susan Collins warned there is an increased likelihood that inflation will stay notably above the Fed’s 2% target. A soft inflation reading is the single cleanest brake available, but nothing in the current data stream points that way.
Second, auction demand would need to recover. The rise in Treasury yields accelerated following a weak $70 billion auction of five-year notes. Weak auctions signal that the buyers needed to absorb U.S. debt supply are demanding a higher price to show up. Until that changes, every auction is a potential catalyst for another leg higher in yields.
Third, the Fed would have to signal a genuine pause. Long-duration assets should remain volatile until inflation and fiscal uncertainty improve. Williams’s comments Thursday moved the market in the opposite direction. With the next FOMC meeting scheduled for October 27 to 28, traders have five weeks to decide how much of the next hike odds are already in long-bond prices.
The Trader’s Lesson
Thursday was a masterclass in correlation risk. When yields move this fast and this far, sectors do not fall independently. They fall together, scaled by their sensitivity to the discount rate. Traders who spread across real estate, homebuilders, utilities, and small caps believing they were diversified discovered they owned the same yield-duration risk in different wrappers. In a rate shock, the question is not which stock you own. It is how much duration your whole book is carrying.