
Most traders have never noticed the weird market anomaly that happens at 9:35 AM every morning.
They’re too busy with lagging indicators trying to predict the next move… when the market makers have already set the tone for the trading day.
It’s this weird anomaly that points us to the market maker’s key levels above and below.
And by playing the move within that range…
Regular folks like you have been able to reach for $100 or more (on a $1K stake) over 600 times in the last 2 years.
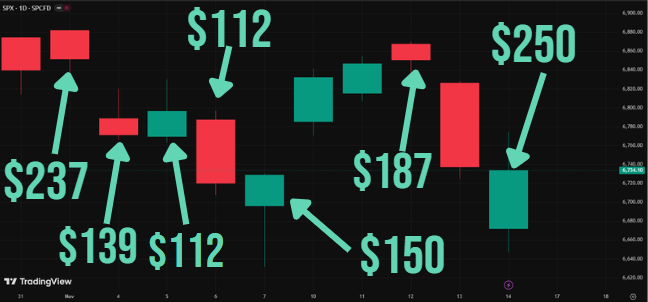
We’ve seen this straightforward approach play out whether the market broke out… broke down… or stayed choppy.
Granted, I can’t make trading guarantees here.
But I’ve opened up the data behind those trades, as well as how you can get in on the very next morning opportunity.
You’ll find the full details right here.
See you in the market.
Chris Pulver
Nvidia Hit a Record. The Stocks You Actually Own Probably Didn’t.
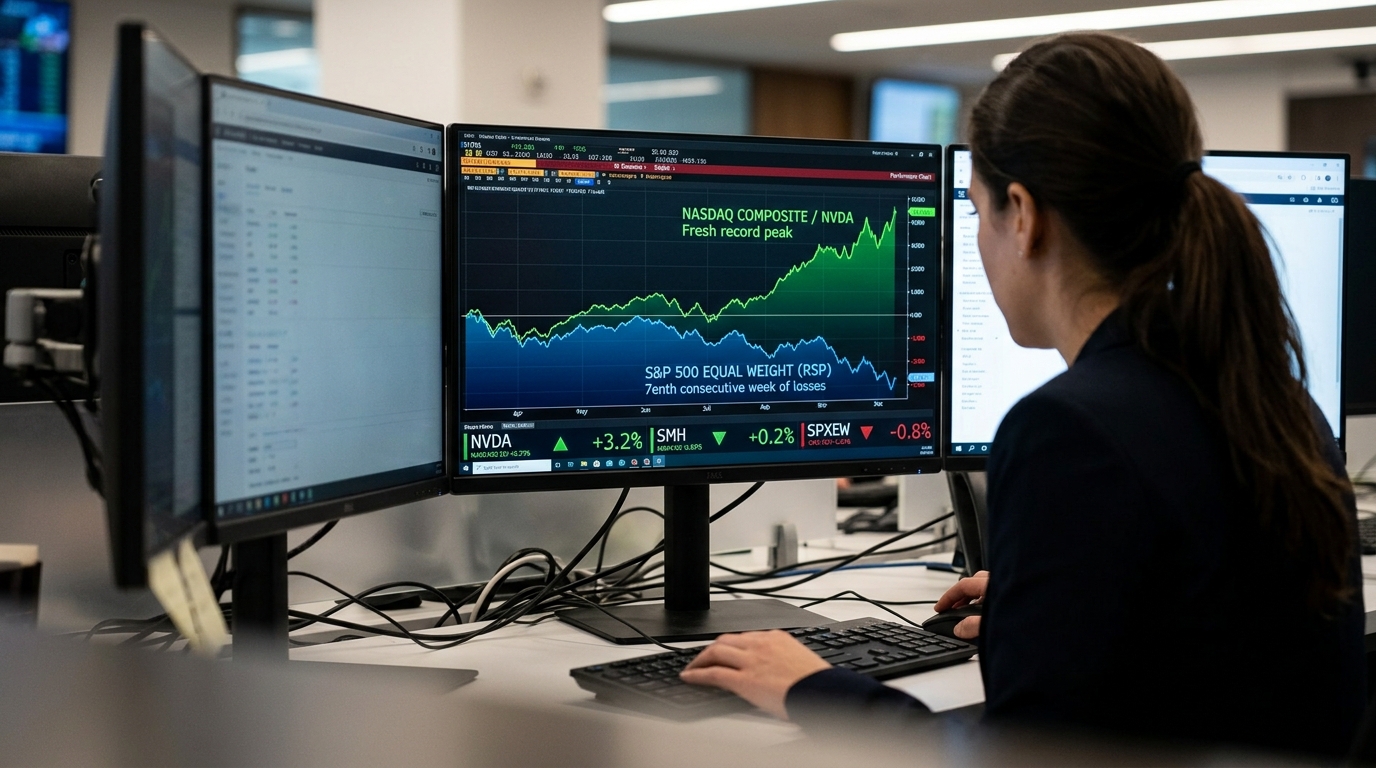
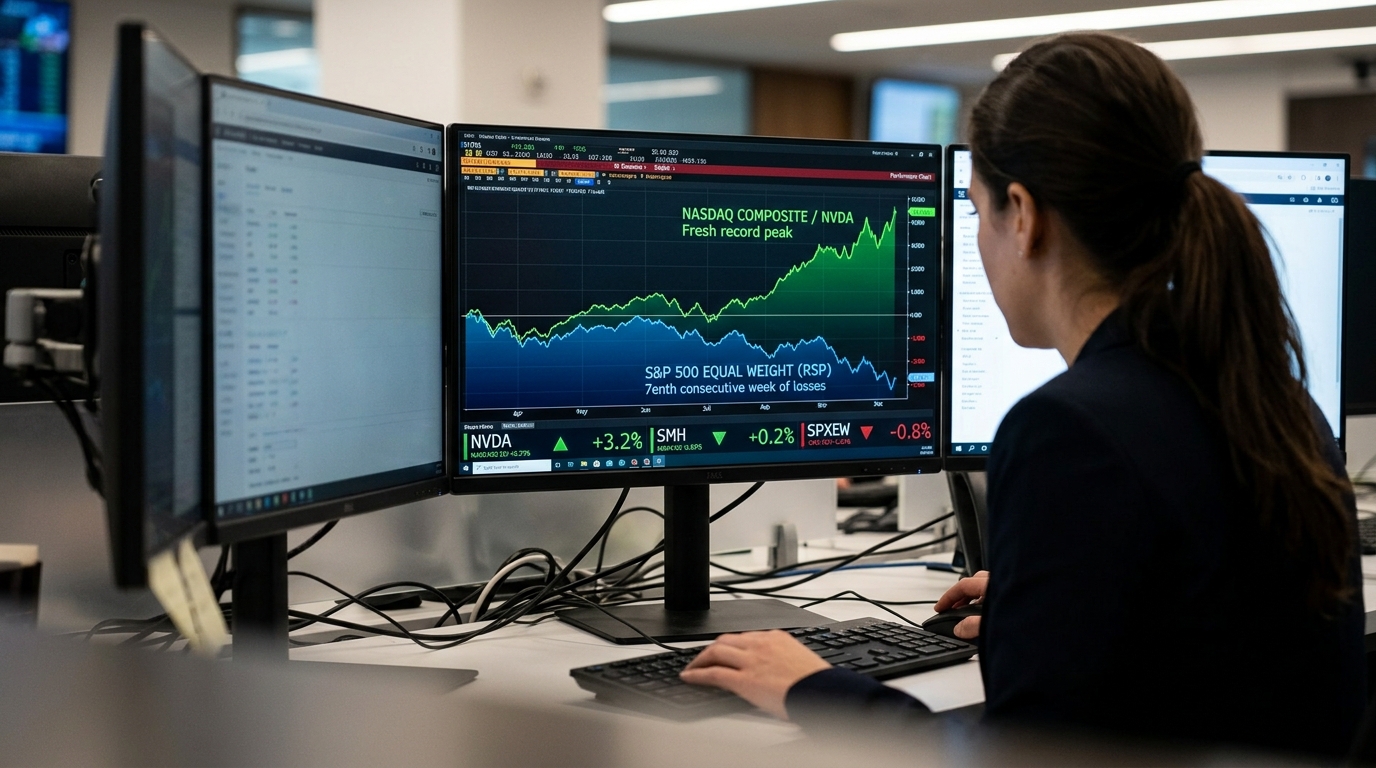
Friday’s session handed traders one of the most instructive lessons of the year: the index you follow and the portfolio you hold can tell completely different stories at the same time.
Tech was an especially bright spot, with the Nasdaq Composite climbing to a fresh high, powered by a record in Nvidia and a general revival in semiconductor makers following Micron Technology’s blowout results. Nvidia shares surged nearly 3% intraday on Friday, touching $237.88 and surpassing the previous intraday high of $236.54 set on May 14. The stock closed up about 1.3% at $233.95, bringing its market capitalization to about $5.6 trillion, within striking distance of the $6 trillion threshold.
But much of the investable universe ended the week with losses, as a multi-week global bond selloff and crude oil near $100 a barrel hurt the parts of the market most sensitive to interest rates and the economy. The Dow Jones Industrial Average lost 1.3% for the week, while the S&P 500 was weaker by 0.3%. The equal-weight index notched its seventh straight weekly decline, with gains heavily concentrated in a handful of AI technology giants.
Why the Index Lied to Most Portfolios
When Nvidia carries a roughly $5.6 trillion market cap, it pulls cap-weighted indexes higher regardless of what the other 499 constituents are doing. The S&P 500 sits about 1% from its all-time high, but the equal-weight index, small caps, bank stocks, utilities, and high-risk technology shares are all under varying degrees of selling pressure. Watching the QQQ and feeling good about it right now is one of the more dangerous habits a trader can develop.
The catalyst for Friday’s relief rally wasn’t AI enthusiasm, it was macro. Stocks rallied as yields retreated, following a surprisingly weak September jobs report that suggested the Federal Reserve may stay on hold at this month’s policy meeting. At the same time, oil prices pulled back following news that the G7 said it plans to release 100 million barrels of oil and fuel products in the coming weeks. This week saw market pricing for a rate hike later this month drop sharply. That shift drove the move in tech, not a change in fundamentals.
Micron’s fiscal Q4 provided a genuine fundamental backdrop. Micron delivered a record quarter, with revenue up 379% year over year and gross margin reaching 86.8%, while Q4 revenue climbed 31% quarter over quarter to $54.23 billion. CEO Sanjay Mehrotra said the company expects memory and storage supply-demand conditions to be much tighter in fiscal 2027 and 2028 than they were in 2026. That supported the semiconductor complex broadly and gave Nvidia’s move a credible earnings floor to stand on.
How Experienced Traders Read This
The disciplined read on Friday is not “buy semis.” It is “understand what you are actually measuring.” The divergence inside the S&P 500 was stark: most of its components finished September in the red, with tech carrying the index. A trader who sized positions based on index-level strength while holding rate-sensitive names, regional banks, or small caps has been absorbing losses that no headline number reflected.
“That one-two punch of higher energy prices and higher Treasury yields has certainly kept investors on the sidelines over the course of the last month,” said Art Hogan, chief market strategist at B. Riley Wealth. With little on the calendar before the start of third-quarter earnings season, investors will likely remain under the thrall of those same two forces: higher oil prices and higher yields. Friday’s reprieve was driven by a single data point. One jobs report does not end a multi-week bond selloff.
The Trader’s Lesson
Always know what your benchmark is actually measuring. The Nasdaq at a record tells you that Nvidia, Broadcom, and a small cluster of AI infrastructure names are working. It tells you almost nothing about the health of the broader market. The Russell 2000 is down about 8.5% from its August 14 high, the KBW Bank Index is down over 12% from its mid-August peak, and utilities have shed roughly 17% from their February high. Those are not rounding errors hidden inside an otherwise healthy market, they are the market that most portfolios actually own.
Before adding exposure on the back of a record Nasdaq close, ask yourself: is the index you are watching the same market you are trading? When the answer is no, the record is someone else’s story.