
There’s a market signal that shows up around 9:35 AM that most traders completely overlook.
They’re watching RSI.
Moving averages.
Candlesticks.
Trying to figure out where the market is headed next.
Meanwhile, I’m watching what happens in the first few minutes after the opening bell.
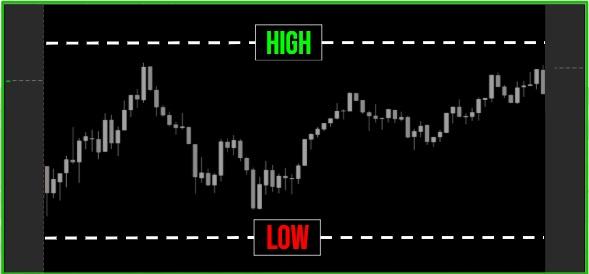
Because that’s where I’ve found a recurring pattern that can help identify key levels above and below the market.
I’ve spent years tracking this behavior.
And over the past two years, we’ve seen this approach produce 618 winning signals.
Now there’s a new test on the table.
Can we get to win #618 before the weekend?
I’ve set a challenge in motion to find out.
No trading guarantees, of course…
But I can show you the data behind the setup, the levels I’m watching, and exactly what I’m looking for as we make our run from #618 toward #620.
If you want to follow along the Challenge, I’ve laid everything out right here.
See you in the market,
Chris Pulver
Netflix Bought Back $4.8B of Stock. Cash Flow Lagged.
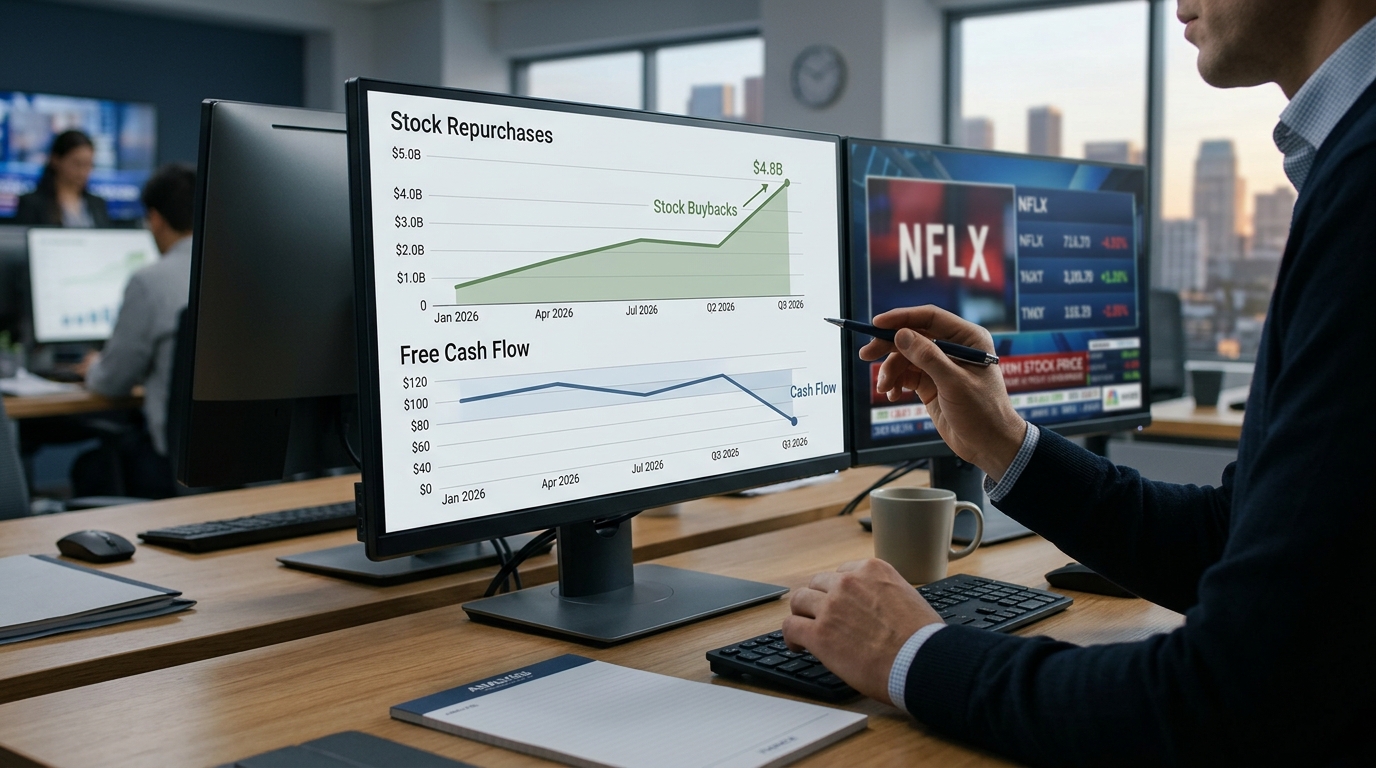
Netflix spent $4.8 billion buying its own shares in the third quarter of 2026, its largest single-quarter repurchase ever. The stock is still down about 33% for the year as of November 3, 2026. That gap between management conviction and market response is exactly what experienced traders should be studying right now.
What the numbers actually show
The buyback figure is not in dispute. In Q3 2026, Netflix repurchased 63.9 million shares for $4.8 billion, and it still holds $22.3 billion in remaining authorization. Operating income climbed 37% to $4.46 billion in the quarter, and revenue grew 11.8% year over year to $12.87 billion, edging past the $0.82 consensus EPS estimate with an $0.87 print. On paper, those are the numbers of a healthy, maturing business.
The problem is the trajectory underneath. Revenue growth ran at 16.2% in Q1, fell to 13.4% in Q2, and slipped to 11.8% in Q3. Management trimmed the 2026 advertising revenue outlook to about $2.7 billion after targeting roughly $3 billion earlier in the year, citing slower-than-expected rollout of some ad product capabilities. That roughly $300 million outlook cut is what pushed traders to reassess the report after the October 20 earnings release, even though the headline beat was clean.
The buyback math that Wall Street is debating
Here is the structural tension that seasoned traders recognize immediately. In Q2, Netflix’s $4.7 billion buyback ran at roughly three times the $1.53 billion in free cash flow the business generated that quarter. The company did not fund that gap primarily by drawing down cash: cash, cash equivalents and restricted cash rose from $8.2 billion at March 31, 2026 to $9.1 billion at June 30, 2026. The Q3 buyback of $4.8 billion again exceeded the quarter’s $2.88 billion in free cash flow.
The tension between buyback pace and free cash flow generation is not unique to Netflix. Meta’s capital allocation under rising borrowing costs shows how differently a self-funded balance sheet handles the same pressure.
Management has guided 2026 free cash flow of approximately $12.0 billion (down from its prior projection of $12.5 billion), which would make the annual buyback pace closer to self-funding in aggregate. But the quarterly mismatch matters for traders watching capital allocation discipline. When a company consistently spends more than it generates in a given period to repurchase shares, it is making an explicit bet that the stock is cheap enough to justify funding the gap with working capital timing, financing sources, or reserves.
Growth stock or value stock: pick one
That is the real debate. Netflix’s transition from a subscriber-growth story to a margin and cash-return story is well underway. The forward price-to-earnings multiple has compressed to the high teens, well below its five-year range, and the buyback yield is now a meaningful component of the total return case. Some commentators are openly predicting a formal dividend by 2027 as the logical next step.
The lesson for active traders is not to confuse a record buyback with a signal to buy. Netflix is demonstrating what happens when a dominant business decelerates: management reaches for capital returns to fill the gap left by slowing growth. That can work over time if cash flow catches up. It fails if the ad business continues missing and content costs creep higher. Watch Q4 free cash flow. That number, more than any earnings beat, will tell you whether the buyback math becomes self-sustaining or a drain.