
Ian Cooper here,
Alert!
If you still haven’t saved your copy of “The $50-to–$500 Options Strategy”…
… do it right now before the download link expires.
We’ll be moving this book behind a paywall in the near future so grab it now while you still can.
You’ll thank me.
FREE: The $50-to–$500 Options Strategy
To your success,
Ian Cooper
Tradewins
Reminder: Grab your copy of “The $50-to–$500 Options Strategy” before we move it behind a paywall.

43% of Builders Are Cutting Prices. Housing Starts Tell Us If It Gets Worse.
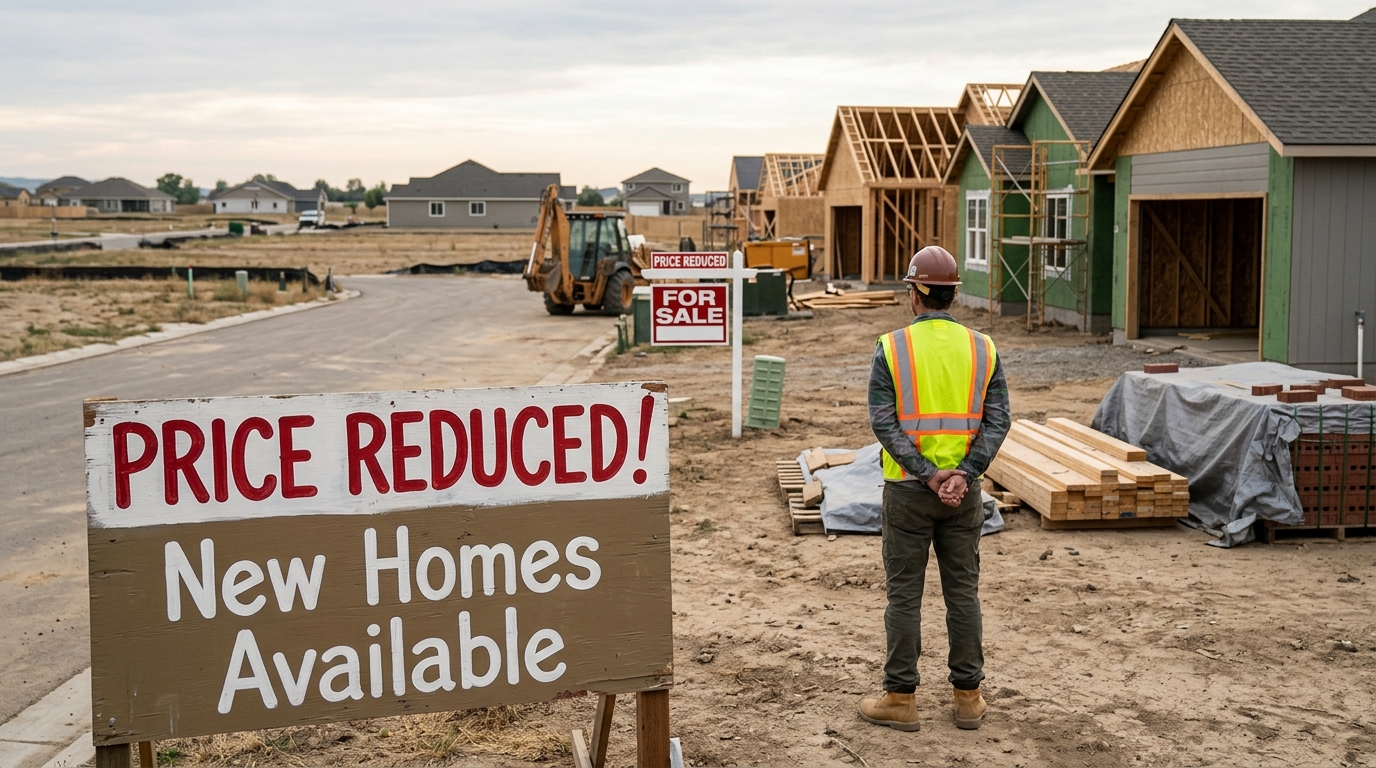
The NAHB/Wells Fargo Housing Market Index hit 29 in October, its lowest reading since June 2012. That number landed Monday and instantly reframed this morning’s release. The index dropped from 32 in September to 29, below the 31 consensus by two full points. Every component fell. Current sales conditions slid two points to 33, future sales expectations dropped five points to 32, and prospective buyer traffic fell five points to 18. That traffic reading, 18, is the lowest since April 2012 if you exclude the one-month pandemic shock in April 2020, and it is the number that should worry traders most. Buyers who are not walking through doors today are not signing contracts in 60 days.
The price-cut data confirms the squeeze is real, not psychological. Some 43% of builders cut prices in October, up from 38% in September and the highest share in the 2020-2026 period, while the average price cut held at 6% for a seventh consecutive month. Meanwhile, 65% of builders reported using sales incentives, the 19th consecutive month that at least 60% offered buyer sweeteners. Builders are not trimming prices to capture market share. They are doing it to move inventory while carrying costs compound.
The macro backdrop explains why. Mortgage rates climbed into the mid-7% range in October, according to Mortgage News Daily, as September inflation accelerated to 3.7% and rising Treasury yields pushed borrowing costs higher. In its October housing outlook, Fannie Mae’s Economic and Strategic Research Group projected the average 30-year fixed rate at 7.4% in Q4 2026 and 7.5% across all four quarters of 2027, a substantial revision from September when the agency forecast 6.8% for Q4 and 6.7% for 2027. That is not a tweak. It is a reset of the entire demand outlook, and builders read it that way.
The yield move behind that rate reset did not happen in isolation. The 10-year Treasury climbing toward 5.28% and what one inflation decimal does to mortgage pricing is the mechanism builders cannot hedge against.
What the Starts Number Means This Morning
August housing starts came in at 1,275,000 units on a seasonally adjusted annual rate, with building permits at 1,394,000. Single-family starts in August rose 7.6% to 918,000 while multifamily slumped 22.5% to 344,000. The September consensus sits near 1.31 million total starts, per Trading Economics estimates.
Here is how to read the number. A September print below 1.25 million validates the NAHB gloom: builders are responding to deteriorating traffic by pulling back activity, and the sector stocks, D.R. Horton (DHI), Lennar (LEN), PulteGroup (PHM), and materials plays like Builders FirstSource (BLDR) and Home Depot (HD), will likely extend their existing downtrends. A print above 1.33 million tells a different story: single-family starts are holding even as sentiment craters, which would suggest large public builders are still producing, absorbing the pain through incentives rather than cutting volume.
The split between single-family and multifamily matters as much as the headline. Permits lead starts, and single-family permits are the cleaner signal of the underlying housing cycle because multifamily projects are lumpy and can swing the total. Watch single-family permits for September. If they fall below the August 878,000 rate, forward production pipelines are contracting, and that is unambiguously bearish for builder margins through the first half of 2027.
Single-family permit contraction ripples beyond the builders themselves. Paint and coatings suppliers like Sherwin-Williams face a prolonged drag from weak residential new construction even when their own execution is strong.
How Professionals Are Likely Watching This
Disciplined traders are not trading the headline number in isolation. They are weighing it against what the stocks have already priced. DHI is down about 10% over the past year, LEN is down in the mid-30% range, and PHM is down about 10%. Some deterioration is already in the price. The question is whether today’s starts data reveals a new floor or an accelerating decline.
A weak starts print combined with weak permits is the scenario that forces the next leg lower, particularly for Lennar. A starts figure that holds near August levels, by contrast, could spark a short-covering bounce in DHI or PHM given their compressed valuations, though any rally into that data should be treated as a trading move rather than a fundamental shift until mortgage rates demonstrate sustained relief.
The Trader’s Lesson
Sentiment surveys like the NAHB index tell you what participants feel. Hard data like housing starts tell you what they are actually doing. The two diverge regularly, and the gap between them is where trading opportunities and traps both live. This morning, the lesson is not which direction housing stocks move at 8:31. It is that a single data point rarely resolves a structural problem. The NAHB index has been below 50, the line dividing poor from good conditions, for about 30 consecutive months, and below 40 for about 18 straight months. That duration matters. Markets that have been broken for that long require more than one good number to reverse. Position accordingly.